Check out the source code at Observable.
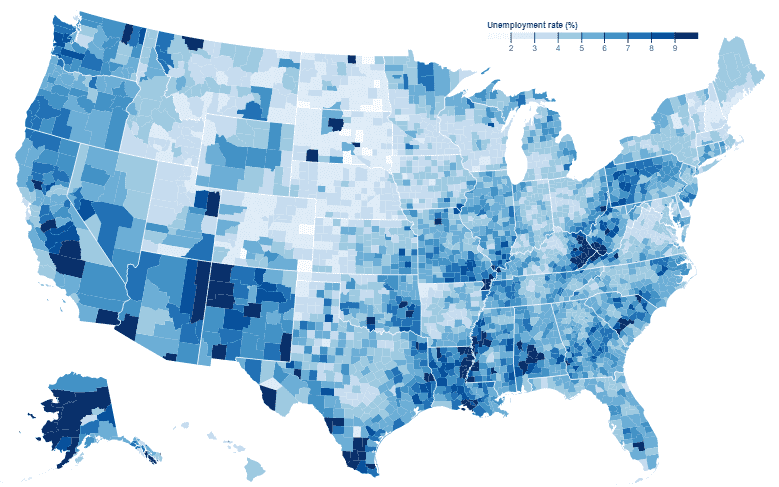
To understand the purpose of this tool it is important to understand what a Bivariate Choropleth Map is. Lets break it down. Bivariate simply means two variables. Choropleth translates from the greek choro (area) + plethos (multitude). A standard Choropleth map with one variable, or a Univariate Choropleth, might display the unemployment rate in every county in the United States by shading counties based on that rate. In the map below, counties with higher unemployment rates are shaded darker than those with lower rates. This creates an easy to understand visualization of the data.
Source: @d3/choropleth
Creating a color scale for a Univariate Choropleth is straightforward, featuring shades of the same base color. This process becomes more complicated when we want to show the relationship between two variables in a Bivariate Choropleth. The map below is a Bivariate Choropleth that shows the relationship between Diabetes and Obsetity rates on the county level.
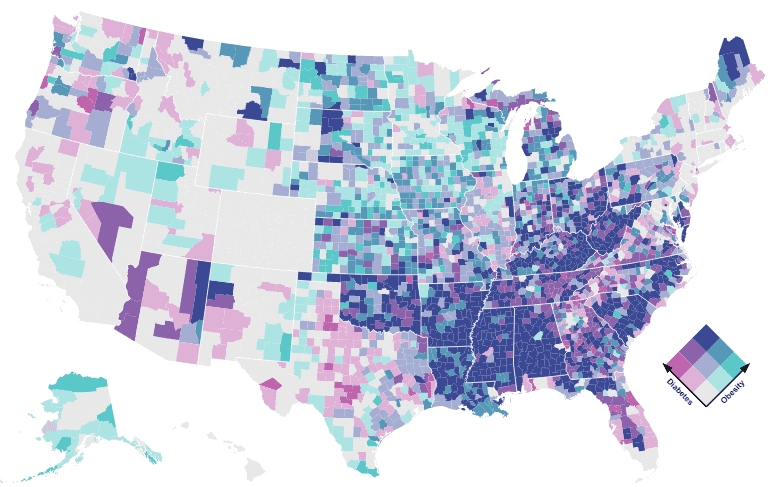
Source: @d3/bivariate-choropleth
It takes a little more time to understand what the various colors mean, but that is because there is more information being conveyed by the map. A good Bivariate Choropleth not only shows data, it shows a relationship between two data sources. I think the above map is compelling in that many counties with high obesity also have high diabetes and that most of these counties are concentrated in the same geographical area. The color scheme helps to convey this message and also makes the map nice to look at. The pink color (diabetes) and teal color (obesity) pair well side by side, but also blend together well into a darker blue/purple. Creating a color scheme that looks good and is well balanced can be a challenge.
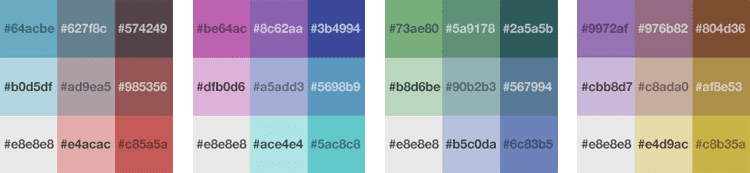
There are a few established color schemes floating around the web, but what if you want your own unique look? Making one of these color schemes by trial and error is time consuming and difficult. Enter this tool. It takes care of all the color blending for you and hopefully offers enough options to fit your needs.
For further reading on Bivariate Choropleths check out this great article.